
 5 Stars Rated On Clutch

Real Estate & Construction
Middle East
Staff/Resource Augmentation
When we first sat together for a discussion, the company highlighted multiple challenges in its current workflow. Here are the key issues we identified:
Commission and Brokerage Analysis
The client wanted to analyze the contributions of different brokers and sales teams by evaluating earnings from commissions and brokerage fees to understand their performance better.
Inventory Status Reporting
They needed to provide an overview of the inventory across properties by calculating the amount of inventory per square meter. This would help in understanding space density and availability to optimize property management.
Lead Generation Report
The company wanted to track the number of leads generated and the engagement from visitors. They also wanted to categorize these leads by their source for more effective targeting and analysis.
Off-Plan Recognition and Collection Tracking
There was a need to develop a system to track off-plan property recognition and collection, giving top management clearer visibility into these activities to support strategic decision-making.
To address these needs, the project involved:
Creating dashboards to track broker performance, inventory levels, lead generation, and off-plan recognition.
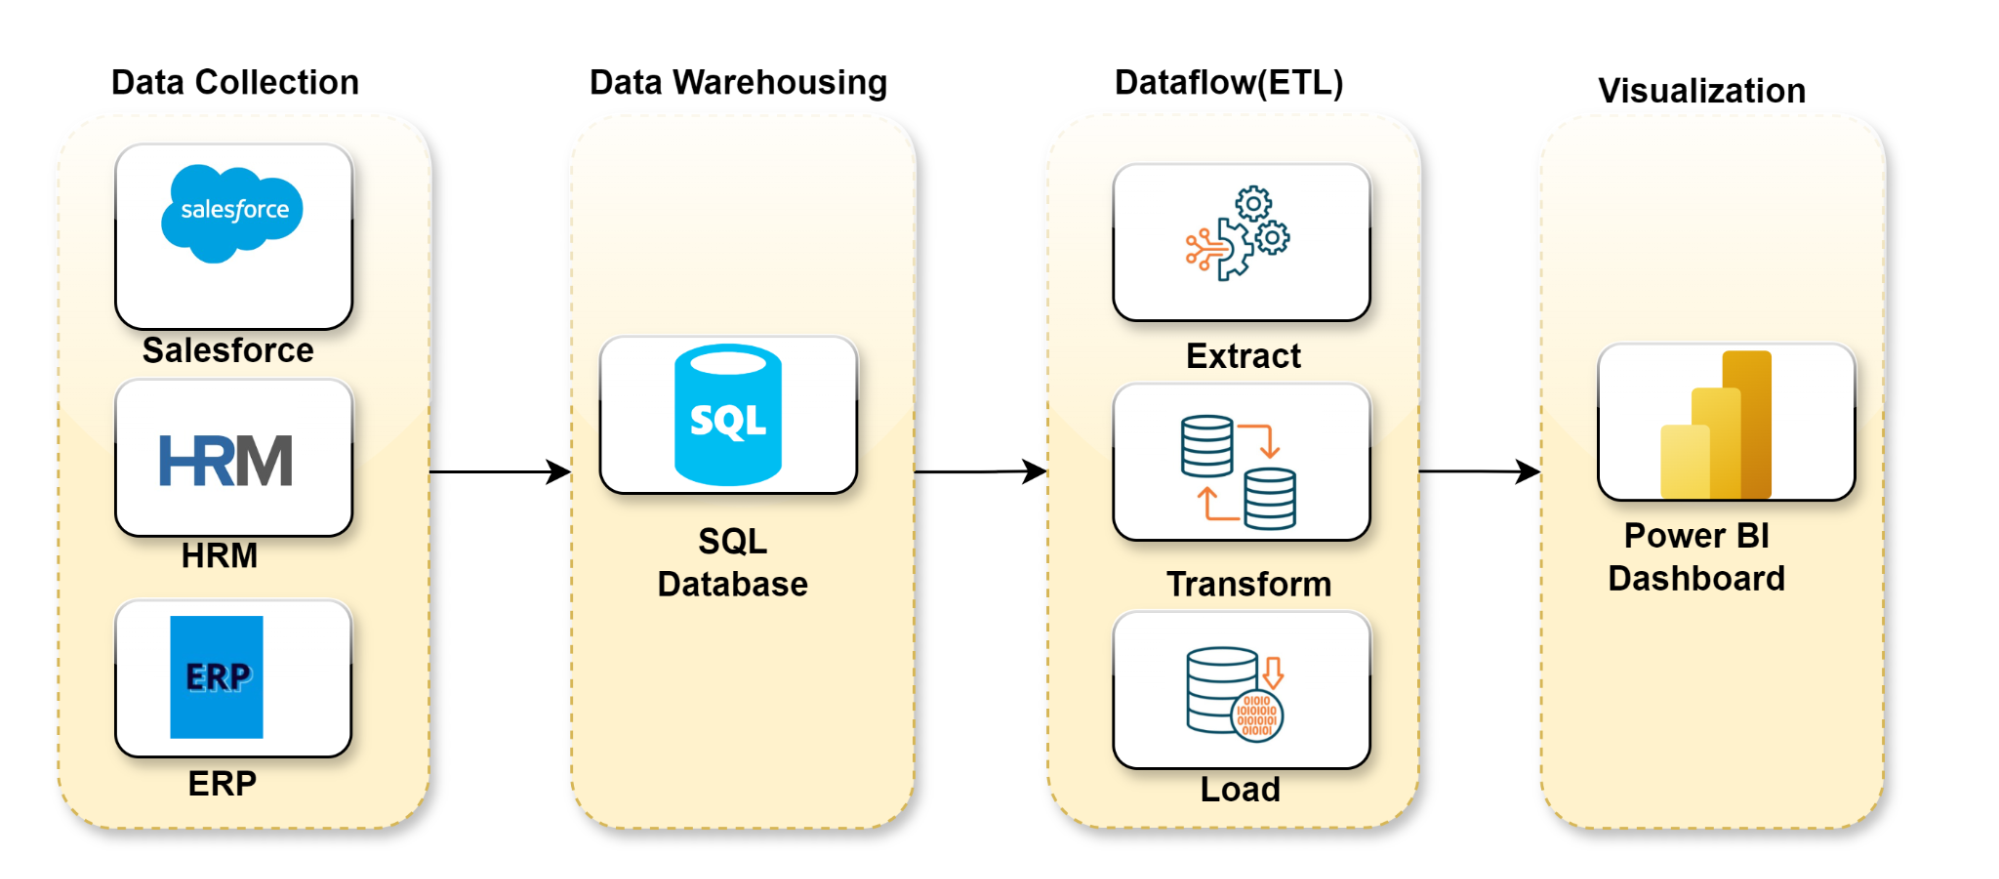
Utilizing data from Salesforce, HRM, and ERP systems to provide accurate, real-time insights.
Leveraging Power BI to create interactive reports that would help management make informed decisions based on comprehensive, real-time data.
Our experts implemented a robust, streamlined workflow to address the company’s HR data management and analytics challenges. Here’s how our team of experts solved their issues:
Data Extraction
Data was gathered from the client’s Salesforce, HRM, and ERP systems through APIs or export tools. This included sales records, employee performance data, and operational metrics related to inventory and financials.
SQL Database Management
All data was stored in a structured SQL database with relational tables, ensuring easy access and data integrity for subsequent analysis.
ETL Implementation
Extraction: Relevant data was extracted from the SQL database.
Transformation: The data was cleansed, aggregated, and normalized to create a consistent format for analysis.
Loading: The transformed data was loaded into the system for visualization and reporting.
Power BI Dashboard Set-up
Power BI was used to connect to the SQL database and fetch processed data, which was then used to create interactive dashboards and reports.
Enhanced Performance Visibility
The custom Power BI dashboards analyzed 500+ individual commission records monthly, helping identify top performers and enabling data-driven resource allocation.
Optimized Inventory Management
Resolved 50+ recurring inventory issues, reducing holding costs and improving property utilization across multiple sites.
Improved Lead Tracking
Categorized 120+ monthly leads, boosting conversion rates by 20% from high-performing sources and enhancing marketing efficiency.
Increased Visibility into Off-Plan Activities
Monitored 100+ off-plan projects, enabling timely revenue recognition and strategic decision-making.
Streamlined Collection Monitoring
Reduced overdue payments by 15% and shortened collection cycles by 10 days, improving cash flow and financial oversight.
The Power BI dashboards improved broker performance tracking, inventory management, lead tracking, and off-plan collection monitoring. These changes helped the company make better decisions, streamline operations, and boost overall business success.
Submit your details & our experts will reply you with a quote very soon.
Your information is kept secure and confidential. We respect your privacy and will not share your data with third parties without your consent.

Download PDF
DataToBiz is a good choice for someone who wants a partner who understands the product journey, requirements, and delivery expectations. They have the experience and agility to understand what’s possible and deliver to the client’s expectations. They‘re really passionate people, and they know what they’re doing!
We’re impressed with DataToBiz’s professionalism, dedicated support, and consistent follow-ups. Their team maintains clear communication through online meetings, ensuring a smooth and reliable collaboration.
A solution like this is a good fit if your teams spend more time collecting and reconciling data than acting on it, if reports from different departments do not match, or if decisions depend on delayed or manual reporting. It also fits when your data is growing in volume or sources, and your current setup struggles to keep up.
DataToBiz starts with a discovery call to review your goals, data sources, and reporting gaps. You get a clear view of the expected outcomes, effort, and timeline before any commitment.
Yes. Every solution DataToBiz delivers is configured around your industry, business processes, and existing data environment. The team assesses your current systems, data quality, and reporting needs first, then designs a solution that works with what you already have instead of replacing it. This applies across industries such as manufacturing, retail, healthcare, finance, and logistics, and across setups ranging from legacy databases to cloud data platforms.
DataToBiz works across the major analytics, cloud, and data engineering stacks. For BI and visualization, this includes Power BI, Tableau, and Looker. For cloud platforms, it includes Microsoft Azure, AWS, and Google Cloud. For data warehousing and processing, it includes Snowflake, Databricks, and SQL-based databases. Data sources include ERP and CRM systems, spreadsheets, APIs, IoT and sensor data, and third-party applications.
If your stack includes a tool not listed here, the team can assess compatibility during discovery.
Most projects with DataToBiz take from a few weeks to a few months. The timeline depends on how ready your data infrastructure is for the initiative and how many systems need to connect. Smaller solutions go live quickly, while larger programs roll out in phases so you see value early. After an initial discovery call, you receive a timeline with clear milestones.
Security and governance is part of the plan from the first conversation. DataToBiz works within your security policies and follows the regulations that apply to your industry. The project usually Access stays limited to the people who need it, and confidentiality terms cover the engagement from kickoff to handover.
The work does not stop at go-live. Your team gets a proper handover and guidance on using the solution, and DataToBiz stays available for questions and improvements. The business impact of the project is measured against the goals set at the start, so you can see exactly what changed for your company.
DataToBiz is a Data Science, AI, and BI Consulting Firm that helps Startups, SMBs and Enterprises achieve their future vision of sustainable growth.
DataToBiz is a Data Science, AI, and BI Consulting Firm that helps Startups, SMBs and Enterprises achieve their future vision of sustainable growth.