

What would you like your AI agent to do? We will take it from there.
Talk to an Expert

Case study

Standardizing Power BI Dashboards for a USA based Healthcare Facility5.0 rating5 Stars Rated On Clutch

Industry

Healthcare & Life Sciences

Services Used

Business Intelligence (BI), Data Analytics, Power BI

Region

India

Engagement Model

Managed Analytics

Function/Department

Strategy and Planning

Summarize with AI:

About Client

  • A healthcare solutions provider, serving over 90 million members across the United States of America.
  • They focus on using the latest technology in healthcare to improve operations for payers, providers, and partners in the medical industry.
  • The hospital chain aims to enhance care quality, streamline member and provider experiences, and achieve cost-effective, positive healthcare outcomes.

Problem STATEMENT

As the client’s business grew and technology advanced with time, scalability became a crucial concern. With over 149+ departments relying on Power BI dashboards, the lack of standardized dashboard design hindered the consistency and efficiency of decisions across the organization and among relevant stakeholders. This lack of uniformity across dashboards led to these alarming issues:
    • Inconsistency and Inefficiency:

      Inconsistent visual designs across departments made data hard to surf, forcing employees to spend extra time learning each dashboard’s layout.

    • High Maintenance Costs:

      Fragmented dashboard designs led to duplicated efforts and higher maintenance costs, as each one needed individual updates, consuming unnecessary resources.

    • Brand Polarity and Missed Modernization:

      Non-harmonized elements designs weakened the organization’s brand image and failed to keep up with modern UI/UX trends, reducing overall user engagement.

    • No Reusable Components:

      Each existing Power BI dashboard was built from scratch, wasting time and making scaling difficult.

Solution

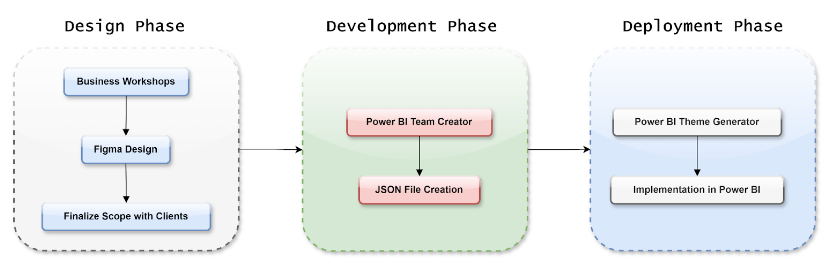
After going through the shared objectives and alarming issues the client was facing, our experts presented a phase-wise plan for the dashboard revamp.
Revamped Design Standards and Templates

    • Developed clear design guidelines covering color schemes, fonts, layouts, and visual elements to ensure a consistent look across all dashboards.
    • Created Power BI templates with pre-configured themes, layouts, and reusable components to streamline dashboard creation and ensure consistency.

Centralized Design Repository

    • Set up a SharePoint repository to store all design assets (color palettes, fonts, templates) for easy access by all teams, ensuring uniformity.
    • Configured access controls to facilitate collaboration while maintaining resource integrity.

UI/UX Rework

    • Updated existing dashboards to align with modern BI design trends, enhancing the user experience and making dashboards more intuitive and engaging.

Collaboration and Scope Review

    • Worked with stakeholders to define dashboard requirements and validated the scope to ensure clear goals.

JSON Setup Using Power BI Theme Generator

    • Used the Power BI Theme Generator to create JSON files that encapsulate the design standards for color and styling.

Training and Rollout

    • Conducted workshops and training sessions to familiarize teams with new design standards and provided documentation and ongoing support for smooth implementation.

Business Impact

    • Standardizing design across 150 departments created a cohesive, professional appearance, improving user experience and reducing navigation errors by 35%.
    • Streamlined development reduced dashboard creation and update times by 40%, while reusable templates cut creation time by 50%.

    • Consistent visuals reinforced the organization’s brand, improving internal perception by 25% based on employee feedback.

    • The UI/UX revamp, aligned with modern BI trends, increased user engagement and satisfaction by 30%, as seen in post-implementation surveys.

    • Improved data usability led to faster, more informed decisions, boosting operational efficiency by 20%.

    • Users reported a 45% improvement in ease of use and visual appeal, resulting in higher adoption across departments.

    • Comprehensive training ensured that all stakeholders successfully adopted and adhered to the new design standards, with a unified approach to data visualization


The standardization of Power BI dashboards significantly enhanced the client’s operations by streamlining workflow across departments, improving user experience, and maintaining a consistent brand image.
The new BI dashboard templates provided a cohesive appearance and modernized the interface. All-in-all, positive user feedback and maintenance not only resolved existing challenges but also positioned the client for future growth in data analytics in the healthcare sector.

You saw how we solved their business problem. We can do the same for you.

Submit your details & our experts will reply you with a quote very soon.

Your information is kept secure and confidential. We respect your privacy and will not share your data with third parties without your consent.

Frequently Asked Questions(FAQs)

How do I know if a solution like this is right for my business?

A solution like this is a good fit if your teams spend more time collecting and reconciling data than acting on it, if reports from different departments do not match, or if decisions depend on delayed or manual reporting. It also fits when your data is growing in volume or sources, and your current setup struggles to keep up.

DataToBiz starts with a discovery call to review your goals, data sources, and reporting gaps. You get a clear view of the expected outcomes, effort, and timeline before any commitment.

Can DataToBiz customize the solution for my industry and current data setup?

Yes. Every solution DataToBiz delivers is configured around your industry, business processes, and existing data environment. The team assesses your current systems, data quality, and reporting needs first, then designs a solution that works with what you already have instead of replacing it. This applies across industries such as manufacturing, retail, healthcare, finance, and logistics, and across setups ranging from legacy databases to cloud data platforms.

Which tools, platforms, and data sources does DataToBiz work with?

DataToBiz works across the major analytics, cloud, and data engineering stacks. For BI and visualization, this includes Power BI, Tableau, and Looker. For cloud platforms, it includes Microsoft Azure, AWS, and Google Cloud. For data warehousing and processing, it includes Snowflake, Databricks, and SQL-based databases. Data sources include ERP and CRM systems, spreadsheets, APIs, IoT and sensor data, and third-party applications.

If your stack includes a tool not listed here, the team can assess compatibility during discovery.

How long does a project like this take with DataToBiz?

Most projects with DataToBiz take from a few weeks to a few months. The timeline depends on how ready your data infrastructure is for the initiative and how many systems need to connect. Smaller solutions go live quickly, while larger programs roll out in phases so you see value early. After an initial discovery call, you receive a timeline with clear milestones.

How does DataToBiz keep my data secure and compliant during the entire engagement?

Security and governance is part of the plan from the first conversation. DataToBiz works within your security policies and follows the regulations that apply to your industry. The project usually Access stays limited to the people who need it, and confidentiality terms cover the engagement from kickoff to handover.

What support and results can I expect after the solution goes live?

The work does not stop at go-live. Your team gets a proper handover and guidance on using the solution, and DataToBiz stays available for questions and improvements. The business impact of the project is measured against the goals set at the start, so you can see exactly what changed for your company.

DMCA.com Protection Status