What would you like your AI agent to do? We will take it from there.
Talk to an Expert

Case study

Scalable Data Analytics Infrastructure for a Wood Manufacturing Giant5.0 rating5 Stars Rated On Clutch

Industry

Manufacturing & Industrial Engineering

Services Used

Artificial Intelligence (AI), Azure Data Engineering, Business Intelligence (BI), Data Analytics, Data Warehousing, Digital Transformation, ETL, Machine Learning, Power BI, Predictive Analytics

Region

India

Engagement Model

End to End Project Lifecycle Management

Function/Department

Accounting and Finance, Facilities and Administration, Human Resources (HR), Supply Chain Management

Summarize with AI:

About Client

  • A leading manufacturer of wood-based panel products in India, specializing in MDF, HDF, Particle Boards, Laminates, and related products.
  • Known for advanced production technologies and eco-friendly production processes, they serve both domestic and global markets.
  • Their innovative surface solutions are widely used in commercial and residential interior design and woodwork.

Problem STATEMENT

As their business grew and technology advanced, our client struggled with the limitations of their fragmented data systems. These systems made it tough to make informed decisions and slowed down their operations, making it harder to expand. These issues led to performance bottlenecks and limited the ability to scale operations effectively.
    • Data Fragmentation:

      The client faced difficulties in accessing a unified view of business insights due to disconnected data spread across multiple systems.

    • Scalability and Performance Issues:

      The existing systems were unable to handle growing data volumes, resulting in slow performance and delays in reporting in a timely manner.

    • Limited Data Analysis Capabilities:

      The lack of advanced analytics tools and technology hurdled the client’s ability to predict trends and make data-conscious decisions.

    • Inconsistent Reporting:

      Reporting processes varied across departments, leading to misaligned KPIs and inconsistent metrics across multiple departments and involved stakeholders.

    • Manual Workflows:

      Many internal operations were manual, increasing the risk of human error, reducing efficiency, and complicating the existing workflow of the company.

Solution

To help our client overcome their challenges, we built a solution that brought all their data together, made it easier to analyze, and used technology to do things faster. We worked side-by-side with them to create a system that could grow with their business.

Unified Data Platform:

    • Our team developed a centralized data platform using cloud-based warehousing technologies, integrating data from multiple systems into one repository to provide a unified source of truth for all stakeholders.

Advanced Analytics & AI/ML Integration:

    • We implemented AI-driven analytics and machine learning models, enabling predictive insights to help the client forecast demand, optimize inventory management, and make data-backed decisions.

Scalable Infrastructure:

    • We designed a scalable architecture with cloud technologies and distributed processing, ensuring high performance and real-time data processing even as data volumes increased.

Clear, Actionable Information:

    • Our team created automated reporting processes and custom dashboards, ensuring consistent metrics and KPIs across departments for transparency and alignment.

Automation:

    • We automated repetitive manual tasks using workflow tools, reducing human error, improving accuracy, and significantly boosting operational efficiency.

Technical Implementation

We knew we needed to connect their different systems and tools. So, we built a platform that could process and analyze data in real-time, giving them a clear picture(technical architecture below) of what was happening.
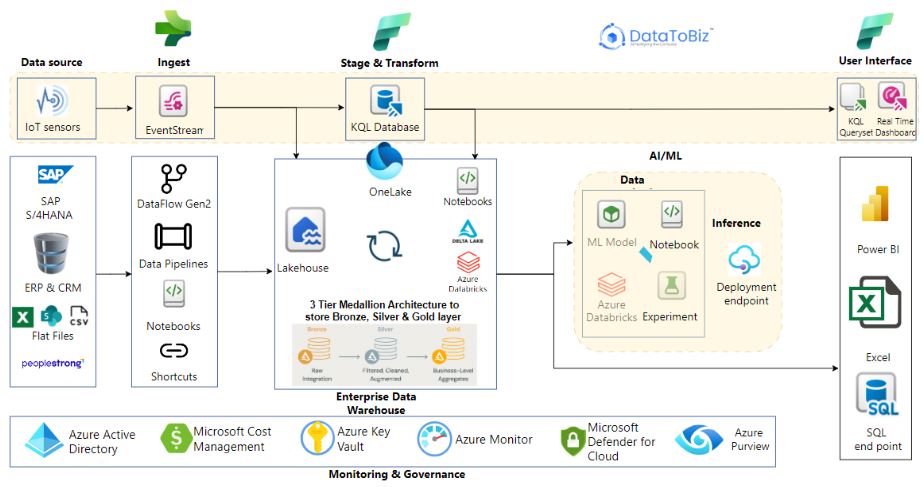
  • Data Ingestion Layer:   We enabled seamless data collection from sources like SAP S/4 HANA, ERP, CRM systems, flat files, and IoT devices using Azure EventStream.
  • ETL Pipeline:   The team implemented Data Fabric Data Flows for efficient data extraction, transformation, and loading (ETL), ensuring smooth data handling.
  • Transformation Layer:  Python and SQL-based transformations were applied within the Data Fabric, using the Medallion Architecture for structured processing of raw, cleaned, and transformed data.
  • Visualization Layer:  Power BI dashboards, combined with KQL Queries, provided real-time reporting and insights from the processed data, enhancing decision-making.

Business Impact

Our client was struggling with scattered data and outdated systems, making it hard to make good decisions and run their business smoothly. We helped them by bringing their data together, improving how they analyzed it, and using technology to do things automatically. This made a big difference in how they operated.
    • The unified data platform improved decision-making speed by 30%, allowing stakeholders to act on insights faster for better outcomes.
    • AI/ML-driven analytics boosted forecasting accuracy by 25%, reducing overstock and stock-out situations by 20%, improving profitability.

    • The scalable infrastructure handled 50% more data, ensuring smooth operations as the client’s data demands grew.

    • Automation reduced operational tasks by 40% and cut human errors by 35%, leading to a 30% increase in productivity.

    • Standardized reporting eliminated 90% of discrepancies in KPIs, improving cross-department collaboration and strategic planning.

    • Real-time dashboards cut reporting lag by 60%, enabling faster responses to market changes and opportunities.


Thanks to a scalable infrastructure and standardised reporting, the client was able to handle increasing amounts of data and ensure consistent operations across different departments. Improved efficiency and the ability to predict future trends gave them a competitive edge, both domestically and internationally, setting them up for long-term success.

You saw how we solved their business problem. We can do the same for you.

Submit your details & our experts will reply you with a quote very soon.

Your information is kept secure and confidential. We respect your privacy and will not share your data with third parties without your consent.

Frequently Asked Questions(FAQs)

How do I know if a solution like this is right for my business?

A solution like this is a good fit if your teams spend more time collecting and reconciling data than acting on it, if reports from different departments do not match, or if decisions depend on delayed or manual reporting. It also fits when your data is growing in volume or sources, and your current setup struggles to keep up.

DataToBiz starts with a discovery call to review your goals, data sources, and reporting gaps. You get a clear view of the expected outcomes, effort, and timeline before any commitment.

Can DataToBiz customize the solution for my industry and current data setup?

Yes. Every solution DataToBiz delivers is configured around your industry, business processes, and existing data environment. The team assesses your current systems, data quality, and reporting needs first, then designs a solution that works with what you already have instead of replacing it. This applies across industries such as manufacturing, retail, healthcare, finance, and logistics, and across setups ranging from legacy databases to cloud data platforms.

Which tools, platforms, and data sources does DataToBiz work with?

DataToBiz works across the major analytics, cloud, and data engineering stacks. For BI and visualization, this includes Power BI, Tableau, and Looker. For cloud platforms, it includes Microsoft Azure, AWS, and Google Cloud. For data warehousing and processing, it includes Snowflake, Databricks, and SQL-based databases. Data sources include ERP and CRM systems, spreadsheets, APIs, IoT and sensor data, and third-party applications.

If your stack includes a tool not listed here, the team can assess compatibility during discovery.

How long does a project like this take with DataToBiz?

Most projects with DataToBiz take from a few weeks to a few months. The timeline depends on how ready your data infrastructure is for the initiative and how many systems need to connect. Smaller solutions go live quickly, while larger programs roll out in phases so you see value early. After an initial discovery call, you receive a timeline with clear milestones.

How does DataToBiz keep my data secure and compliant during the entire engagement?

Security and governance is part of the plan from the first conversation. DataToBiz works within your security policies and follows the regulations that apply to your industry. The project usually Access stays limited to the people who need it, and confidentiality terms cover the engagement from kickoff to handover.

What support and results can I expect after the solution goes live?

The work does not stop at go-live. Your team gets a proper handover and guidance on using the solution, and DataToBiz stays available for questions and improvements. The business impact of the project is measured against the goals set at the start, so you can see exactly what changed for your company.

DMCA.com Protection Status